Phenomena Involved in Biofilm Control
The attack of an antimicrobial agent on a microbial biofilm is a complex interaction. Among the phenomena involved are convective and diffusive transport of the antimicrobial through the bulk fluid to the surface of the biofilm and into the interior of biofilm cell clusters, sorption and chemical reaction of the antimicrobial with components of the system and with the biofilm itself, physiological diversification and adaptation by the microorganisms, killing of microbial cells, and chemical and mechanical alteration of the biofilm matrix leading to removal or detachment of biofilm.
Watching a biocide act on a biofilm is a way to gain some intuition about these phenomena. In the experiment described in the following images and movies, researchers at the Center for Biofilm Engineering visualized the interaction of two common biocides, a quaternary ammonium compound and free chlorine, on a staphylococcal biofilm.

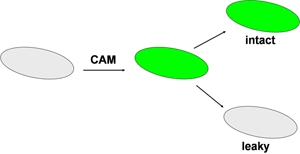
This experiment makes use of a special stain that loads the bacteria with a green fluorescent molecule (Figure 1). The stain itself, Calcien AM (CAM), is a fluorogenic esterase substrate. It is not fluorescent and is uncharged. After passing through the cell membrane, the CAM is cleaved by ubiquitous enzymes called esterases. This generates a product that is fluorescent green and also multiply charged. The fluorescent product is not bound to anything; it is simply loose in the cytoplasm of the cell. As long as the cell membrane remains intact, the dye will be retained within the cell by virtue of its charge. If the cell membrane is permeabilized, for example by the action of an antimicrobial, then the green color will leak from the cell. This can be imaged under the microscope.

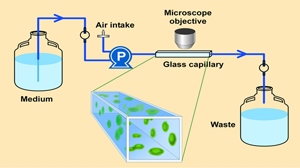
The experimental system for growing the biofilm is a flow cell (Figure 2). This flow cell is just a glass tube that has a square cross section. A microscope objective can be brought down to the flat top wall of the tube and, using confocal scanning laser microscopy, one can image cell clusters clinging to the ceiling of the capillary. In transmission mode microscopy (Figure 3), large, dense clusters of staphylococci (dark areas) can be seen hanging from the ceiling and side walls of the tube. The capillary is approximately 1 mm on each side, so the cell clusters shown here are a few hundred microns in diameter.


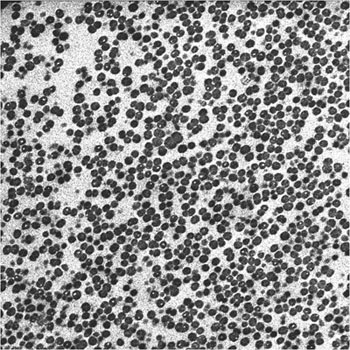
Looking inside one of these cell clusters by transmission electron microscopy, now at much higher magnification TEM, densely aggregated individual bacterial cells (dark spheroids) can be seen (Figure 4). The faintly stained material in between the cells is the normally highly hydrated extracellular matrix that holds the biofilm together.
Video 1 shows a cell cluster that has been stained with CAM to load the cells with the green fluorescent dye. This video is an overlay of the transmission image, in grayscale showing where the biomass is, and the green fluorescent channel, showing cells that have been loaded with green fluorescence. This video is a 1 hour time-lapse during treatment with flowing 50 mg per liter chlorine. Flow is from left to right. The solution is at neutral pH so the chlorine is chemically a mixture of hypochlorite ion and hypochlorous acid. It appears that biomass around the edges of the cell cluster is liquefied by this treatment and gets washed downstream by the flow. The biofilm holds onto much of its green color which means that many of the cells in the interior of the biofilm retain their membrane integrity. Only in a narrow zone right at the periphery of the cell cluster, perhaps ten or twenty microns wide, does the green color leak out. This is consistent with incomplete penetration of chlorine into the biofilm. Chlorine probably fails to penetrate fully due to its neutralization by reactions with biomass in the surface layers of the biofilm.
With a different antimicrobial, a very different pattern is seen (Video 2). In this 1 h time-lapse video, a staphylococcal biofilm is being treated with 50 mg per liter of a quaternary ammonium compound (QAC).
This type of disinfectant is commonly used in industry and in consumer products. With the QAC there is no removal of biomass or change in the biofilm structure. Flow is from left to right. The biofilm does wiggle in the flow some, a reminder that biofilms are viscoelastic structures that can deform and move. The spatial and temporal patterns of loss of green fluorescence is complex (Figure 4). There appear to be three phases. In the first phase, the rate of green fluorescence loss is controlled by penetration into the biofilm. Once the QAC penetrates to a particular depth, it acts quickly on about half the cells. The remaining cells lose color more slowly. This is suggestive of a subpopulation that is less susceptible.
Chlorine and QAC have quite different effects on the biofilm. This indicates that distinct phenomena govern the biofilm-antimicrobial interaction in the two cases. In the following section, some of the hypothesized mechanisms that protect microorganisms in biofilms are discussed.

